NewPower BI · custom visualFreeFree to use, ours to own
Pulse Gantt: a free Gantt chart for Power BI
Pulse Gantt is a free Gantt chart visual for Power BI with task dependencies, the critical path, baseline against actual, milestones and a today line. Try it live, then download it.
- Version
- 1.0.0.0
- Power BI visuals API
- 5.11.0
- File
- .pbiviz · 49 KB
- Published
- November 8, 2026
Download
Version 1.0.0.0
Free to use, ours to own
Use it in any report, personal or work. Don't sell or share the file. Read the terms
A free account, the same one you use for components. Pulse Gantt 1.0.0.0, .pbiviz, 49 KB.
SHA-256
a4bd7915a988ad89f7502a51ac95d2d85edb39138731c877e8d539fc1bb692efHow to check the file
In Windows PowerShell:
Get-FileHash .\pulse-gantt-1.0.0.0.pbiviz -Algorithm SHA256On macOS or Linux:
shasum -a 256 pulse-gantt-1.0.0.0.pbivizThe result should be the 64 characters above.
What it does
Dependencies
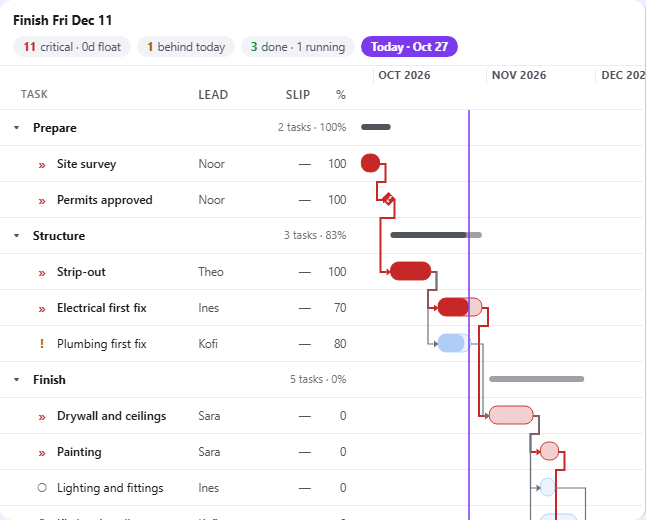
Connector lines from each task to the ones that wait for it, from Task ID and Predecessors.
The critical path
A built-in float engine counts spare working days, weekends excluded; tasks with none are marked in red with an icon.
Planned against actual
The baseline under each bar, slip badges, a Slip column, and a header that names the task driving the finish date.
Milestones and a today line
A Start with no End draws a diamond. The today line shows what's behind.
Groups that fold
Up to three levels, such as phase, each with a roll-up bar and its progress.
Light, dark and high contrast
Every status has an icon or text as well as a colour. Motion stops for reduced-motion settings.
Try it live
The demo runs Pulse Gantt's own code in your browser, inside a small stand-in for Power BI. Add fields to the wells, change the format options, switch to dark or high contrast.
Runs the visual's own code on made-up data, in your browser. Nothing is sent anywhere.
Download the sample data (CSV): A made-up project of 14 tasks in four phases, with Task ID, predecessors, a baseline, progress and an owner's first name.
Examples
Screenshots from the demo, on its made-up data.
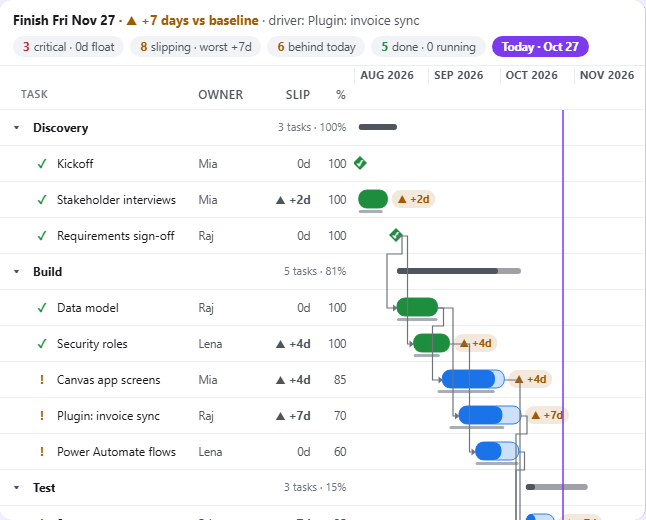
Planned against actual: the baseline under each bar, slip badges, and the task driving the finish date. 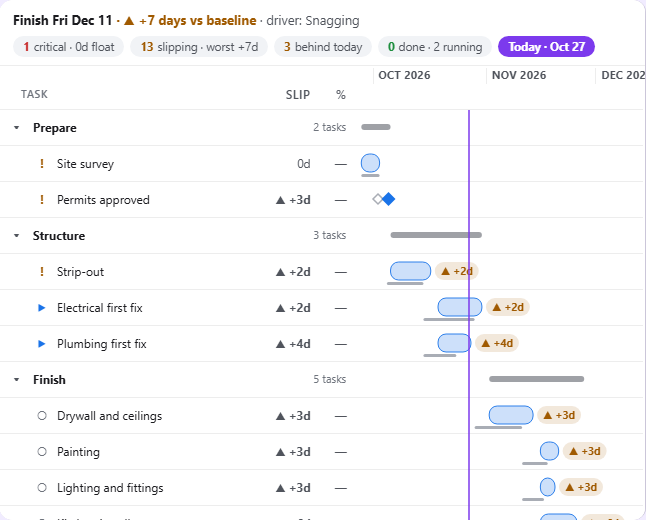
Milestones and slip: a Start with no End draws a diamond. 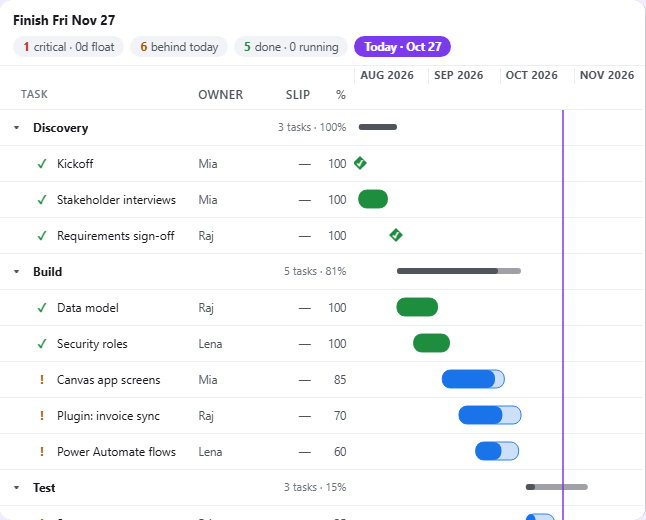
Phases and progress: Group by stacks tasks under each phase, with a roll-up bar. 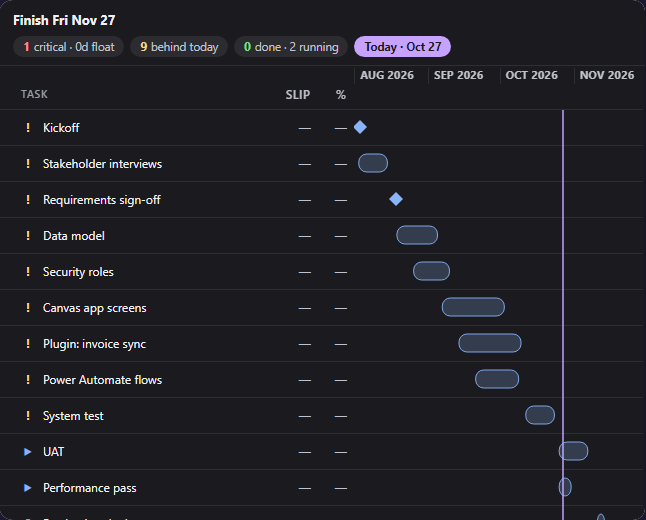
On a dark report background, the visual switches to light text by itself.
Add it to a report
- Sign in and download
pulse-gantt-1.0.0.0.pbiviz. Check its SHA-256 if you like. - In Power BI Desktop, turn on developer mode for this session: Microsoft Learn asks for it each session you import a visual from a file.
- In the Visualizations pane, select the ellipsis (…), then Import a visual from a file, and open the file. Pulse Gantt appears as a new icon at the bottom of the pane.
- Add it to the page and put your columns in its fields. The field guide below says what goes where.
These steps follow Microsoft Learn's Import a visual file from your local computer into Power BI.
Field guide
What to put in each field of Pulse Gantt by LowCodeStacks, what the visual does with it, and the mistakes that are easy to make. Every statement here was checked against the visual's code.
| You want | Put in these fields |
|---|---|
| A bar per task | Task, Start, End |
| Phases with progress | add Group by and Progress |
| Connector lines and the critical path | add Task ID and Predecessors |
| What slipped against the plan | add Baseline start and Baseline end |
| A milestone | a Start with a blank End |
- Task, Group by, Task ID and Predecessors are categories. Power BI makes one row for each different combination of their values, plus any text or date field in Columns. So a task with two rows in your table, which differ in one of those fields, becomes two rows in the chart.
- Start, End, Progress, Baseline start, Baseline end, Critical flag and Tooltips are values. Power BI aggregates them for each row, so each one needs the right aggregation (the arrow next to the field in the well). Microsoft's Work with aggregates page lists earliest, latest, first and last as the options for dates, and Sum as the default for numbers.
- The rows arrive sorted by Start, earliest first (the visual asks Power BI for that sort). A blank sorts as the lowest value, so rows with no Start come first. Groups appear in the order of their first task.
- The visual reads up to 10,000 rows.
Task
- What it means: the label for each row. The only required field: with Task empty, the visual shows its landing page.
- Column type: any. Usually text.
- Aggregation: none. It's a category.
- Good example: a task name column, such as
TaskorActivity. - Values: shown as text, with the column's format.
- If it's empty: for one row, the row is labelled with its position, starting at 1.
- Tips and mistakes: two tasks with the same name stay separate when another category tells them apart (a Group by or a Task ID). Selecting a row, by click, Enter or Space, selects that task for cross-filtering; Ctrl-click adds more.
Group by
- What it means: up to three levels that group the tasks, outermost first, such as phase and then workstream.
- Column type: any. Usually text.
- Aggregation: none. It's a category.
- Good example:
Phase, orStagethenCrew. - Values: each different value becomes a group row with an arrow to collapse it. The group row shows how many tasks are under it and their progress, weighted by each task's length in days.
- If it's empty: for one row, the row goes in a group called (Blank).
- Tips and mistakes: each group row has a roll-up bar from its tasks' earliest start to their latest end; collapsed, the group also keeps its milestones on that bar. Connector lines to hidden tasks attach to the group's row. Where Power BI turns interactions off (on a dashboard tile, for example), groups can't be collapsed.
Start
- What it means: the day the task starts.
- Column type: Date (or Date/Time; the time is ignored).
- Aggregation: Earliest. With one row per task, Earliest and Latest give the same date; Earliest keeps the task's first date if it has several rows.
- Good example:
Startwith the Date data type. - Values: the visual takes the calendar date of each value. A bar covers its Start day to its End day, both in full.
- If it's empty: with an End, the task is drawn as a one-day bar on its End date. With neither, the row has no bar.
- Tips and mistakes: check the column's data type is Date. A number in Start is read as milliseconds since 1 January 1970, so an Excel serial date such as 46293 puts the bar in January 1970; Sum is Power BI's default for a number column, while a Date column gets date options (earliest, latest, first and last) instead. Count gives a number too, with the same result. Text dates are read with the browser's date reader, which can land a day early west of UTC, so set the type to Date in Power Query instead.
End
- What it means: the day the task ends, counted in full.
- Column type: Date (or Date/Time; the time is ignored).
- Aggregation: Latest, so a task with several rows ends on its last date.
- Good example:
EndorFinish date. - Values: as for Start. An End before its Start draws a sliver at the Start.
- If it's empty: for a row with a Start, the task is a milestone: a diamond on its Start day.
- Tips and mistakes: to make a milestone, leave End blank. Don't put the same date in Start and End: that's a one-day task, not a milestone.
Progress
- What it means: how complete the task is. It fills the bar and the % column.
- Column type: a number.
- Aggregation: Sum when each task has one row. If a task can have several rows, use Average or Maximum: see the mistake below.
- Good example:
Progressfrom 0 to 1, or% completefrom 0 to 100. - Values: each value is read on its own. Above 1, it's divided by 100 (so 0–100 works); from 0 to 1, it's taken as it is. Anything below 0 counts as 0 and anything above 100% as 100%. At 100% the task counts as done: green with a ✓, unless it's on the critical path, which keeps the critical colour and icon.
- If it's empty: for one row, the bar has no fill and the % column shows a dash.
- Tips and mistakes: on a 0–100 column, a value of 1 or less is misread: 1 (meaning 1%) shows as 100% and done, and 0.5 as 50%. Convert the column to 0–1 if it can hold such small values. With Sum, two rows of 0.6 for one task add up to 1.2, which is then read as 1.2%.
Task ID
- What it means: the identifier that Predecessors lists point at.
- Column type: text or a number.
- Aggregation: none. It's a category.
- Good example:
Task IDwith values such asT1,T2, orActivity IDwithA1,A2. - Values: compared as text, exactly:
T6doesn't matcht6orT 6. A number 5 matches the text5. - If it's empty: for one row, that row's ID becomes its position in the sorted list, counting from 0. With the whole field empty, every row gets its position as its ID.
- Tips and mistakes: Task ID does nothing on its own; it's what makes Predecessors work. Keep IDs unique: if two rows share one, links go to the first in Start order.
Predecessors
- What it means: the tasks this task waits for. Each one draws a connector line from the end of that task to the start of this one, and links the two in the float engine.
- Column type: text (a number works for a single ID).
- Aggregation: none. It's a category.
- Good example:
Predecessorswith values such asT6, T7; T8. - Values: IDs separated by commas, semicolons or vertical bars (
,;|), with or without spaces around them.T6, T7; T8andT6;T7|T8both mean T6, T7 and T8. Each ID must match a Task ID exactly. A task listing itself is ignored, and an ID that matches no task is dropped from the lines and the float, though the tooltip's After line still lists it. - If it's empty: for one row, the task waits for nothing.
- Tips and mistakes: bind Task ID too. Without it, the IDs are row positions from 0, so
T3matches nothing and no lines are drawn; plain numbers are worse, because3would link to the fourth row. Every link is finish-to-start with no lag: a link type or lag written into the ID, as in3FS+2 days, makes it an unknown ID that's dropped. A loop (T12 waits for T13, which waits for T12) is a cycle: see The float engine.
Baseline start
- What it means: where the task's original plan started, for the grey baseline line.
- Column type: Date.
- Aggregation: Earliest, as for Start.
- Good example:
Baseline startorPlanned start. - Values: as for Start.
- If it's empty: for one row, the baseline line uses Baseline end for both ends. With both empty, the row has no baseline.
- Tips and mistakes: for a milestone, Baseline start is its planned date: when it moved, the old date shows as a hollow diamond tied to the new one by a dotted line, and the slip is the Start minus the Baseline start.
Baseline end
- What it means: where the task's original plan ended. The slip is the task's End minus its Baseline end, in calendar days (weekends included). It drives the slip badges, the Slip column and the header's verdict.
- Column type: Date.
- Aggregation: Latest, as for End.
- Good example:
Baseline endorPlanned finish. - Values: as for End. A positive slip is late (▲ +3d); a negative one is early (▼ -2d).
- If it's empty: for one row, Baseline start is used in its place. With both empty, there's no slip.
- Tips and mistakes: slip badges show only for late tasks, and only where there's room to the right of the bar; they're left out in high contrast, where the Slip column still gives the number.
Critical flag
- What it means: your own critical path, for example a flag exported from Microsoft Project, in place of the one the visual computes.
- Column type: text (Yes/No, True/False) or a number.
- Aggregation: First for text, Maximum for a number.
- Good example: a
Criticalcolumn with Yes or No. - Values: critical when the value is true, a number above 0, or the text
true,yes,yor1in any case. Anything else, including a blank, is not critical. - If it's empty: for one row, that task isn't critical. As soon as any field is in this well, it decides for every task, and the computed critical path is off.
- Tips and mistakes: with the flag bound, Critical within in the format pane has no effect.
Columns
- What it means: up to three extra columns beside the task names, such as owner or status.
- Column type: any. Text and dates are shown as they are; a number is aggregated like a value.
- Aggregation: none for text and dates (they're categories); Sum or another aggregation for numbers.
- Good example:
Owner. - Values: shown with the column's format, in a narrow column that cuts long text short. The column heading is the field's name. Text and date fields come before number fields, whatever their order in the well.
- If it's empty: for one row, the cell is blank.
- Tips and mistakes: a text or date field here is a category, so a task with two owners becomes two rows. Use a single-valued column, or put the field in Tooltips instead.
- When the list is narrow: the list keeps the task names at least 80 px wide and leaves out the columns that don't fit, keeping Slip and % first, then your Columns in order, then the start and end dates. Widen the task list (format pane, Task list, Width) to bring them back.
Tooltips
- What it means: up to five more fields for the tooltip.
- Column type: any.
- Aggregation: any; the tooltip shows the result with the field's name, such as Sum of Budget.
- Good example:
Budget,Owner. - Values: shown under the visual's own tooltip lines: the task and its group path, Schedule, Progress, Baseline, Slip, Float (and "on the critical path"), and After (the predecessors).
- If it's empty: for one row, that line is left out.
- Tips and mistakes: tooltips work even where Power BI turns interactions off.
With dependencies bound, the visual works out each task's float: the working days it can slip before it pushes a successor, chained through to the project end. For a task with successors, float is the smallest of (working days between its end and the successor's start, plus that successor's float). A task with no successors floats against the project end, which is the latest End (or a milestone's Start) in the data. Working days are Monday to Friday; there are no holidays, and the days counted are those strictly between the two dates.
- Tasks with float at or under Critical within (format pane, Critical path; 0 by default, up to 30) are the critical path: drawn in the critical colour, with the » icon, and a thicker line in that colour between two critical tasks.
- Without dependencies, every task floats against the project end, so only the tasks finishing within the threshold of the last day are critical.
- A cycle (tasks that wait for each other) has no order, so float can't be worked out through it. The visual finds it and leaves the tasks on it, and every task after them, out of the float and the critical path: their tooltips have no Float line, and they're never critical. Their bars and lines are still drawn. It never guesses which link is wrong; fix the data.
- A Critical flag field replaces all of this for every task.
The header reads the result: Finish (the project end), the slip against baseline (the worst slip on the critical path), and, when the project is late, the driver: the earliest-starting task that slipped at least as much. When no critical task has a baseline, the slip compares the project end with the latest baseline date in the data.
| Card | Options (default) |
|---|---|
| Critical path | Critical within, working days of float (0, from 0 to 30); Dim non-critical tasks (off); Hatch critical bars (off; hatches the filled, progress part of a critical bar, so it needs Progress) |
| Status colours | Critical path, Done, In progress, Slip vs baseline. On a dark background the visual uses lighter versions of the defaults until you pick your own. |
| Header | Show header (on; needs the visual at least 160 px tall); Schedule health chips (on); Verdict sentence (on) |
| Task list | Width (360, from 160 to 800; it never takes more than 55% of the visual's width, or less than 160 px); Start and end columns (off); Slip column (on); Progress column (on). Columns that don't fit beside the task names are left out. |
| Dependencies | Show dependencies (on); Critical chain only (off) |
| Baseline | Show baseline (on); Slip badges (on) |
| Axis | Today line (on); Weekend shading (on; drawn when days are at least 4 px wide) |
| Canvas | Background (white; a dark colour switches the visual to its dark look); Row height (36, from 24 to 64); Animate on load (on) |
In Windows high contrast, the visual uses only the two colours Power BI gives it, drops the weekend shading and slip badges, and keeps every status readable from its icon and text. The animation never plays for anyone whose device asks for reduced motion.
| What you see | Likely cause | Fix |
|---|---|---|
| The landing page, no chart | Task is empty | Add a field to Task |
| Rows, but no bars | Start and End are empty | Add Start and End as Date columns |
| Bars back in 1970 | Start or End is a number (Sum or Count) | Change the column to Date; use Earliest and Latest |
| No connector lines | Predecessors without Task ID, or IDs that don't match exactly | Add Task ID; check the IDs and separators |
| A task shows done at 1% | A 0–100 Progress column with a 1 in it | Use a 0–1 column |
| Progress is far too low | Sum over several rows went above 1 | Use Average or Maximum |
| One task on two rows | A Columns or category field differs between its rows | Move that field to Tooltips |
| A column in Columns doesn't show | The task list is too narrow for it | Widen Task list > Width |
| Some tasks have no Float in the tooltip | A dependency cycle, or the task has no dates | Find the loop in Predecessors |
| The critical path ignores Critical within | Critical flag is bound | Remove it to use the computed path |
Your data stays in your report
Sends nothing
Pulse Gantt asks Power BI for no special permissions: its capabilities file lists no privileges, so it has no web access, can't download files and can't use your browser's storage. Since API version 4.6.0, Power BI requires a visual to declare these privileges (Microsoft Learn, Capabilities and properties of Power BI visuals). Its code makes no network requests: we check every version for them before we publish it. It draws your data inside the report and sends it nowhere, to us or anyone else. Power BI itself is covered by Microsoft's terms.
Not certified by Microsoft yet
Certification is optional. Until a visual is certified, Power BI doesn't export it to PowerPoint or show it in emailed report subscriptions, and an organisation that allows only certified visuals blocks it unless an administrator adds it as an organizational visual (Microsoft Learn, Certified Power BI visuals; Manage Power BI visuals admin settings).
Support
Questions or a problem with the visual: contact@lowcodestacks.com, with the visual's version. We answer as we can; the visual is free and comes with no support commitment.
What it needs
- Power BI Desktop or the Power BI service
- Visuals from a file allowed in your organisation
- Task, Start and End as a minimum
- Up to 10,000 tasks
- Version 1.0.0.0 · API 5.11.0
Known limits
- The date axis fits the visual's width; it doesn't zoom.
- Every link between tasks is finish-to-start, with no lag.
Change log
1.0.0.0
First release, November 8, 2026
The first release: task dependencies, the critical path from a working-day float engine, baseline against actual with slip badges, milestones, the today line, groups that fold, and light, dark and high contrast.
SHA-256 a4bd7915a988ad89f7502a51ac95d2d85edb39138731c877e8d539fc1bb692ef
The terms
Free to use, ours to own
Use Pulse Gantt in any report, personal or work, and share the reports you make with it. The full terms say exactly what's allowed.
You can
- ✓ Use them in any report, personal or work
- ✓ Share and publish reports that use them
- ✓ Build reports with them for clients
You can't
- ✕ Sell the visual or the file
- ✕ Share the .pbiviz file itself; link here instead
- ✕ Expect a warranty: they're provided as is