NewPower BI · custom visualFreeFree to use, ours to own
Pulse KPI: free KPI cards for Power BI
Pulse KPI is a free KPI card visual for Power BI: status against a target, even when lower is better, the change since the last period, and a trend line, one card per category.
- Version
- 1.0.0.0
- Power BI visuals API
- 5.11.0
- File
- .pbiviz · 44 KB
- Published
- November 3, 2026
Download
Version 1.0.0.0
Free to use, ours to own
Use it in any report, personal or work. Don't sell or share the file. Read the terms
A free account, the same one you use for components. Pulse KPI 1.0.0.0, .pbiviz, 44 KB.
SHA-256
0ff329d76831a6393b8c12268087e99570146297e5d03a9f51369777ce437f35How to check the file
In Windows PowerShell:
Get-FileHash .\pulse-kpi-1.0.0.0.pbiviz -Algorithm SHA256On macOS or Linux:
shasum -a 256 pulse-kpi-1.0.0.0.pbivizThe result should be the 64 characters above.
What it does
Status against a target
On track, at risk or off track, from a band you set beside the target.
Lower is better
For costs, return rates and waiting times, being under the target is on track.
The change since last period
With a Date, each card compares its latest period with the one before.
A trend line with the target
The trend over every period, the target as a dashed line, and the latest point marked.
One card per category
Put a column such as Region in Category for a card per item, up to 24.
Light, dark and high contrast
A dark card switches to light text by itself, and Windows high contrast uses outlines.
Try it live
The demo runs Pulse KPI's own code in your browser, inside a small stand-in for Power BI. Add fields to the wells, change the format options, switch to dark or high contrast.
Runs the visual's own code on made-up data, in your browser. Nothing is sent anywhere.
Download the sample data (CSV): Made-up monthly revenue, revenue targets and return rates for three regions, West, East and North, from November 2025 to October 2026.
Examples
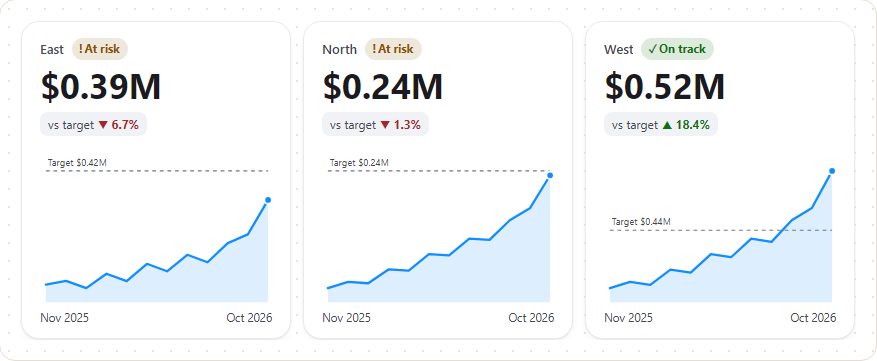
Screenshots from the demo, on its made-up data.
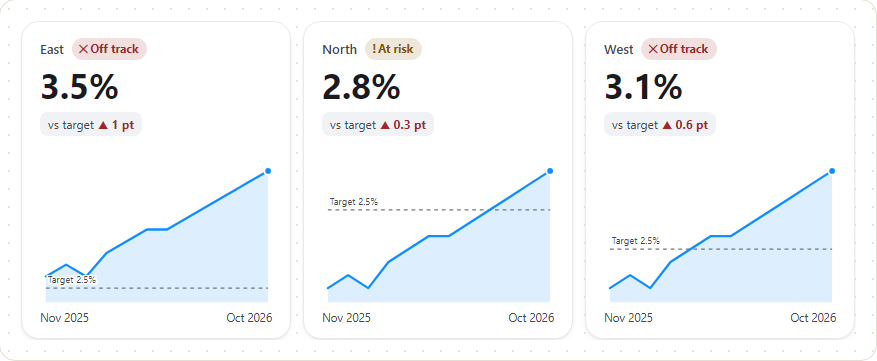
Lower is better: a return rate above its 2.5% target is at risk or off track. 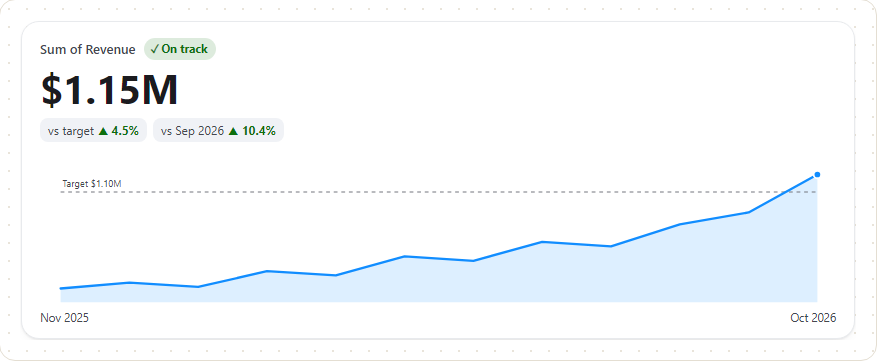
Revenue against target, by month: the change to the target and since the previous period. 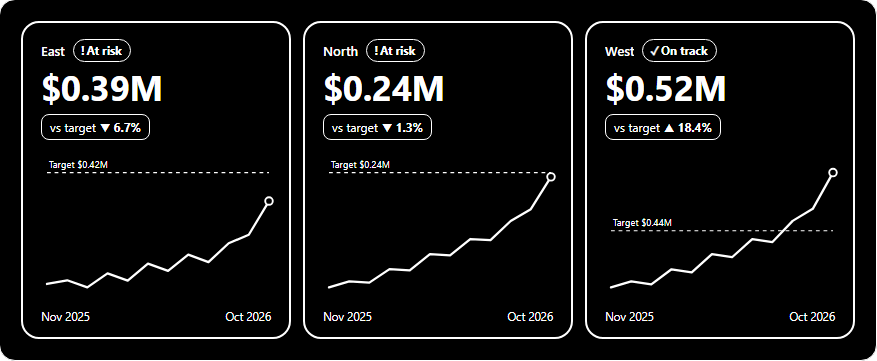
Windows high contrast: only the two colours Power BI gives the visual, with outlines. 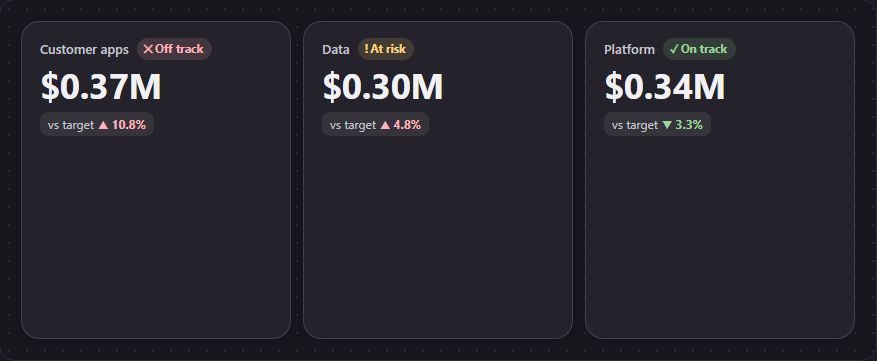
Spend against budget on a dark card, with no Date: the status and the change to target only.
Add it to a report
- Sign in and download
pulse-kpi-1.0.0.0.pbiviz. Check its SHA-256 if you like. - In Power BI Desktop, turn on developer mode for this session: Microsoft Learn asks for it each session you import a visual from a file.
- In the Visualizations pane, select the ellipsis (…), then Import a visual from a file, and open the file. Pulse KPI appears as a new icon at the bottom of the pane.
- Add it to the page and put your columns in its fields. The field guide below says what goes where.
These steps follow Microsoft Learn's Import a visual file from your local computer into Power BI.
Field guide
What each field in Pulse KPI's Build visual pane does, what to put in it, and the mistakes that are easy to make. Every line here describes what the visual's code does.
| Field | Kind of column | Summarised by | Good example | If it's empty |
|---|---|---|---|---|
| Value | A number | Sum, Average or Count, as Power BI offers; or a measure | Revenue (Sum) | No cards: the visual shows its landing page |
| Target | A number, in the same unit as Value | The same way as Value | Revenue target (Sum) | No status, no "vs target" change, no target line |
| Date | A date (the column itself) | Not summarised: it groups | Month | One period: no trend and no "vs previous" change |
| Category | Text | Not summarised: it groups | Region | One card for everything |
| Tooltips | Up to five numbers | Each its own way | Return rate (Average) | The tooltip shows only the card's own figures |
What it means. The number the card shows, large. It's the only field the visual needs: until something is in Value, it shows a short note on what to add.
Column type. A number, or a measure. Power BI summarises a number column for you (Sum by default); pick Average in the field's menu for rates and percentages, which mean nothing added up. A blank or non-number result shows as a dash (—) on the card.
Good example. Revenue, as Sum of Revenue. Or a measure you wrote, such as Total revenue.
With a Date. The card shows the latest period that has a value, not the total. A period with a blank value is skipped, so the card falls back to the last period with data.
Tips
- With no Category, the card's name is the field's name as Power BI sends it, such as "Sum of Revenue". To show something better, use Rename for this visual on the field in the well, or a measure with a clear name.
- The value uses the column's own format string, so set the format on the column or measure in Power BI (currency, percentage, decimals).
- Display units set to Auto picks the unit from each card's own value, the way Power BI's own card does: no unit below 1,000, thousands from 1,000 to below one million ($88.30K, $391.84K), millions from one million ($1.15M), then billions and trillions. A value that rounds up to the next unit shows in it (999,999 is $1.00M). Cards side by side can still differ, such as $940.00K beside $1.15M; pick Thousands or Millions for cards that match.
- Decimal places apply only when the value is shown in a unit (thousands, millions and so on). Otherwise the column's format string decides the decimals.
Common mistakes
- Summing a rate. Ten regions at 3% don't make 30%. Use Average, or better, a measure that divides the totals.
- Storing a percentage as 0 to 100. The visual treats a value as a percentage when its format string contains
%, and then reads changes in points (▲ 0.6 pt), multiplying the difference by 100. So store percentages as 0 to 1 (0.026) and format them as a percentage (2.6%). Stored as 2.6 with no%format, the card shows no % sign, and the changes read as a percentage of each other (▲ 12%) rather than in points. Stored as 2.6 with a%format, Power BI shows 260%.
What it means. The goal the value is compared with. It gives the card its status (on track, at risk or off track), the "vs target" change, and the dashed target line on the trend, with its label ("Target $1.10M").
Column type. A number, summarised the same way as Value: Sum of Revenue target against Sum of Revenue, Average of Return rate target against Average of Return rate.
Good example. Revenue target, one row per month and region, as Sum.
If it's empty. The card shows its value, the change since the previous period and the trend, with no status and no target line.
How the status is worked out. The At risk within (% of target) option (10 by default, 0 to 100) sets a band beside the target, as a share of the target's size.
- Higher is better (the default): at or above the target is on track; below it but within the band is at risk; further below is off track.
- Lower is better, for costs, spend, return rates, waiting times or defects: at or below the target is on track; above it but within the band is at risk; further above is off track.
For example, with a target of 2.5% and the band at 10, the band is 0.25 points: 2.7% is at risk and 2.8% is off track. With the band at 20, 2.8% is at risk.
Tips
- With a Date, the card uses the target of the same period as the value it shows. If that period has no target, the card has no status, even when earlier periods had one.
- The "vs target" change is the difference as a percentage of the target, rounded to one decimal place (
▲ 4.5%), or in points for a percentage. Its colour says whether it's good, by the direction you chose: a rise is good when higher is better, and bad when lower is better. - The target's label on the trend uses the Value's format and display units, so give Target the same format as Value.
Common mistakes
- Leaving Better when the value is on Higher is better for a cost. Spend under budget then shows as off track. Set it to Lower is better (Format visual > Status).
- A target summed over the wrong rows. If the target is stored once per region but your rows are per day, Sum adds it up once per day. Use a target table at the same level as the value, or a measure.
What it means. The periods for the trend line and for "since the previous period". Each card shows the latest period that has a value and compares it with the period before it that has a value ("vs Sep 2026 ▲ 10.4%").
Column type. A date column. The visual takes up to 1,000 periods.
Good example. Month, the first day of each month, used as the column itself.
If it's empty. Each card is the total for everything the report's filters allow, with no trend and no "vs previous" change. That's what you want for a total such as spend against budget.
Month or the date hierarchy. When Power BI's auto date/time is on, a date field comes with a Date Hierarchy (Year, Quarter, Month, Day). Microsoft's auto date/time article explains that you can switch a date field in a well between the column and the hierarchy from the field's menu. Pulse KPI has no drill-down, and its Date well takes one field, so pick the column itself (Month, not Date Hierarchy): you get one period per date in the column. If you use only the Year level, each period is a whole year, and the card compares the latest year with the one before.
Tips
- The period labels use the date column's format string; with none, they read like "Oct 2026". Set the column's format in Power BI to change them.
- The trend needs at least two periods, and room on the card: it's the first thing left out when a card is small.
- The two changes ("vs target" and "vs" the previous period) share one line where they fit. On a narrow card the second one wraps onto a line of its own, and on a very narrow card a change's words wrap inside it. Where a short card needs the room, its row grows to fit and the visual scrolls, so neither change is cut off. Screen readers and the tooltip give both, as before.
- A period with no value breaks the line; the trend picks up again at the next period with data.
- The latest period counts even when it's only partly over. If this month has three days of data, the card shows those three days against the whole month's target. Filter to complete periods if that's not what you want.
Common mistakes
- A completion date, due date or start date as Date. Each card then shows only the latest date that has a value: the last project to finish, not all of them. Leave Date empty for a total, or use a column that gives every row its reporting period (such as a report month).
- The Year level of the hierarchy. The card compares this year so far with all of last year. In the demo's sample, which starts in November 2025, each region shows as 440% to 500% up on 2025.
- A text column of month names. The card treats the last period it receives as the latest, so the periods have to arrive in date order. Use a real date column.
What it means. Splits the visual into one card per item, such as one per region or per team, on a grid. Each card has its own latest period, target, status and trend.
Column type. Text, such as a name or a code.
Good example. Region (East, North, West), or Team.
If it's empty. One card shows everything in Value together.
Tips
- Up to 24 cards: the visual asks Power BI for the top 24 items and shows no more. To choose which 24, add a Top N filter to the visual in Power BI.
- An item with no name shows as "(Blank)".
- The cards go in a grid: as many columns as fit at Minimum card width (220 px by default, Format visual > Cards), and the rows share the visual's height. Below 128 px a row, the visual scrolls.
- With a Category, people can select a card (click it, or Tab to it and press Enter or Space; hold Ctrl for more than one) to filter the rest of the report page, where Power BI allows it. Without a Category there's nothing to filter by, so cards can't be selected.
Common mistakes
- A column with hundreds of items, such as customer names. Only 24 cards show, and they're too small to read. Use a higher-level column, or a Top N filter.
- A number or date column in Category. Use Value for numbers and Date for dates.
What it means. Up to five more measures that show in the card's tooltip when you hover over it, after the card's own figures.
Column type. Numbers, each summarised its own way and formatted with its own format string.
Good example. Average of Return rate beside a revenue card.
What the tooltip shows. The latest period and its value, the target, the change to the target, the previous period's value and the change since it, the status (when Show status is on), then each Tooltips field. A Tooltips field shows its latest value that isn't blank, and a field with no value at all is left out.
Tips
- Tooltips also work where Power BI turns selection off (on some dashboard tiles, for example), as Microsoft asks of visuals.
- The tooltip opens on hover. Someone using a keyboard or a screen reader hears each card's name, value, status and changes instead, so put anything essential on the card, not only in the tooltip.
These are in Format visual, and the demo's Format visual tab shows the same ones.
| Option | What it does | Default |
|---|---|---|
| Status > Show status | The on track, at risk or off track pill. The pill is left out on a card narrower than 150 px. | On |
| Status > Better when the value is | Higher is better or Lower is better, for the status and the colour of each change. | Higher is better |
| Status > At risk within (% of target) | How far from the target, as a share of it, still counts as at risk, 0 to 100. | 10 |
| Status > On track, At risk, Off track | The status colours. Left at their defaults, they turn lighter on a dark card to stay readable. | Green, amber, red |
| Value > Display units | Auto, None, Thousands, Millions, Billions or Trillions. | Auto |
| Value > Decimal places | 0 to 6, used when the value is shown in a unit. | 2 |
| Comparisons > Change to target | The "vs target" change. | On |
| Comparisons > Change since previous period | The change since the previous period (needs a Date). | On |
| Trend > Show trend | The trend line (needs a Date with two or more periods). | On |
| Trend > Target line | The dashed target line and its label. | On |
| Trend > Shaded area | The shading under the line. | On |
| Trend > Line colour | Left empty, a colour from the report's theme (a light blue on a dark card). | Theme |
| Cards > Background | The card colour. A dark colour switches the text and status colours to light ones. | White |
| Cards > Corner radius | 0 to 40 px. | 18 |
| Cards > Minimum card width | 140 to 800 px; below it, cards wrap to a new row. | 220 |
| Cards > Animate on load | The cards rise in once when the data changes. Nothing moves for anyone whose device asks for reduced motion. | On |
Dark reports. Pulse KPI draws its own cards, so on a dark report page set Cards > Background to a dark colour. The visual then uses light text and lighter status colours by itself.
High contrast. When Windows high contrast is on, the visual uses only the two colours Power BI gives it, with outlines instead of fills, and ignores the colours above.
The landing page. Before anything is in Value, the visual shows a short note on what to add, in the report theme's text colour on its background colour, so it reads on a light or a dark theme. In high contrast it uses the high contrast colours.
| What you see | Why | Fix |
|---|---|---|
| The landing page, not a card | Nothing is in Value | Add a number to Value |
| No status pill | No Target, no target for the latest period, Show status is off, or the card is narrower than 150 px | Add a Target at the same level as Value; check the latest period; widen the visual |
| A cost is red while under budget | Higher is better is set | Status > Better when the value is > Lower is better |
| A card shows less than the total | Something is in Date, so the card shows the latest period | Remove Date for a total |
| A rate of 260%, or changes like ▲ 30 pt | A percentage stored as 0 to 100 with a % format | Store it as 0 to 1 |
| No trend line | No Date, one period only, Show trend is off, or the card is too small for it | Add a Date; make the visual larger, or fewer cards per row |
| Only 24 cards | The visual shows the top 24 items | Use a higher-level Category, or a Top N filter |
| Cards in different units ($940.00K, $1.15M) | Display units is Auto, and the values are either side of one million | Pick Thousands or Millions |
Your data stays in your report
Sends nothing
Pulse KPI asks Power BI for no special permissions: its capabilities file lists no privileges, so it has no web access, can't download files and can't use your browser's storage. Since API version 4.6.0, Power BI requires a visual to declare these privileges (Microsoft Learn, Capabilities and properties of Power BI visuals). Its code makes no network requests: we check every version for them before we publish it. It draws your data inside the report and sends it nowhere, to us or anyone else. Power BI itself is covered by Microsoft's terms.
Not certified by Microsoft yet
Certification is optional. Until a visual is certified, Power BI doesn't export it to PowerPoint or show it in emailed report subscriptions, and an organisation that allows only certified visuals blocks it unless an administrator adds it as an organizational visual (Microsoft Learn, Certified Power BI visuals; Manage Power BI visuals admin settings).
Support
Questions or a problem with the visual: contact@lowcodestacks.com, with the visual's version. We answer as we can; the visual is free and comes with no support commitment.
What it needs
- Power BI Desktop or the Power BI service
- Visuals from a file allowed in your organisation
- A number in Value as a minimum
- Up to 1,000 periods
- Version 1.0.0.0 · API 5.11.0
Known limits
- One measure per card: Value takes one field.
- No drill-down: pick the date column itself, not the date hierarchy.
Change log
1.0.0.0
First release, November 3, 2026
The first release: status against a target, including measures where lower is better, the change to the target and since the previous period, a trend line with the target, one card per category, and light, dark and high contrast.
SHA-256 0ff329d76831a6393b8c12268087e99570146297e5d03a9f51369777ce437f35
The terms
Free to use, ours to own
Use Pulse KPI in any report, personal or work, and share the reports you make with it. The full terms say exactly what's allowed.
You can
- ✓ Use them in any report, personal or work
- ✓ Share and publish reports that use them
- ✓ Build reports with them for clients
You can't
- ✕ Sell the visual or the file
- ✕ Share the .pbiviz file itself; link here instead
- ✕ Expect a warranty: they're provided as is